TABLE OF CONTENTS
- How to calculate the required statistics
- Add in the formulas
- What are the Min, Q1, Median, Q3 and Max values?
To display the standardised testing data, statistical data will need to be entered for each combination of Instrument, instrument item, instrument series and jurisdiction.
- Go to the Administration workspace>Standardised testing management>Instruments statistics entry.
- Select the Instrument, instrument Item, Series and Jurisdiction, then enter the required statistics.
- Enter the following statistical information in whole numbers. The steps for obtaining these values can be found below.
- Min: The lowest score achieved by any student in the result set.
- Q1: Quartile 1. The median score of the bottom half of the result set.
- Median: The median of the entire result set (also called Q2).
- Q3: Quartile 3. The median score of the top half of the result set.
- Max: The highest score achieved by any student in the set.
- Click SAVE.
How to calculate the required statistics
NOTE: The statistics for National, Organisation or State will need to be obtained from the relevant body. School statistics can be formulated using a spreadsheet of your data.
The following formulae can be copy-pasted into Excel, where X1:Xn is the range of the cells in which the results are stored. Similar formulae are available for other spreadsheet programs.
- Min: =MIN(X1:Xn)
- Q1: =QUARTILE(X1:Xn,1)
- Median: =MEDIAN(X1:Xn)
- Q3: =QUARTILE(X1:Xn,3)
- Max: =MAX(X1:Xn)
Your spreadsheet data may need to be sorted and filtered to allow you to easily calculate the statistics. A simple example spreadsheet is available here, which contains a subset of some NAPLAN data.
Add in the formulas
- Choose a convenient place to enter the above formulas, depending on how your data is set out.
- Ensure you select the correct cell range. Save the spreadsheet if you want to keep it for reference.
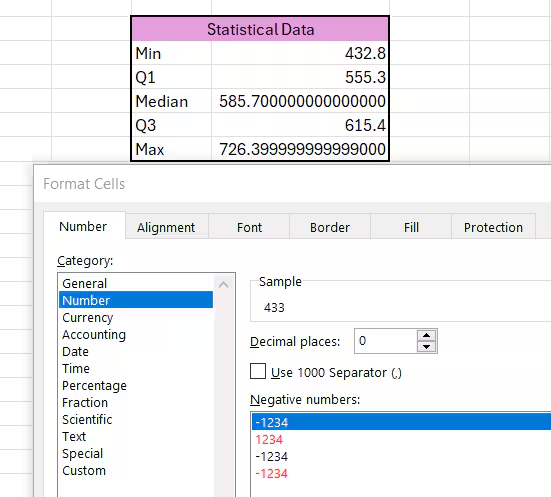
- Format the values to whole numbers:
- Select the cells with the formula
- Right-click on the selected area
- Select Format cells.
- Select Number and set Decimal places to 0 and click OK
- Copy and paste the numbers into SEQTA Teach
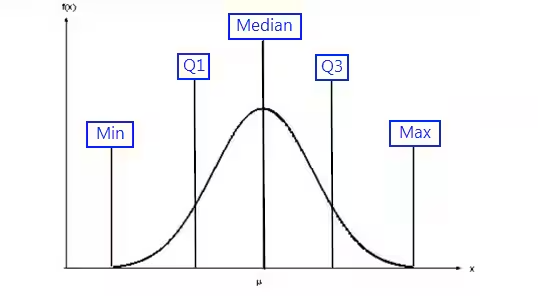
What are the Min, Q1, Median, Q3 and Max values?
The median is the middle point of a number set, in which half the numbers are above the median and half are below. If there are an even number of numbers in a set, to establish the median add the two middle numbers and divide by 2.
Quartile 1 is the point where 25% of all recorded values are are below that point. It is the median of the lower 50% of the values.
Quartile 3 is similar but 75% of the recorded values are below the Q3 point. It is the median of the upper 50% of the values.
Related articles:
Was this article helpful?
That’s Great!
Thank you for your feedback
Sorry! We couldn't be helpful
Thank you for your feedback
Feedback sent
We appreciate your effort and will try to fix the article